
ABSTRACTS
Though evolutionists routinely assume universal common descent of life, observational evidence militates against this unsubstantiated belief. In contrast, creationists recognize limited common descent where originally created kinds of organisms have reproduced to fill the earth. As they have done so, there has been considerable diversification and adaptation, though not enough to transmute them into a fundamentally different type of organism (e.g., from a rodent to a bat). Organisms that are not related by common descent can be recognized by significant holistic discontinuity between them. In this paper we begin an investigation of ruminants (Ruminantia), members of the order Artiodactyla, to determine if there is significant discontinuity between them and other species within this order. In this first paper, two molecular baraminology techniques were applied to available data to determine the relationship of ruminants to other artiodactyls. The results support the hypothesis that ruminants do not share common ancestry with other artiodactyls
The uniqueness of ruminants (Ruminantia) among the even-toed ungulates (Artiodactyla) I: Molecular baraminology studies
by Jean K. Lightner, Matyias Cserhati
[An eKINDS project paper]
The Uniqueness of Ruminants (Ruminantia) Among the Even-Toed Ungulates (Artiodactyla) I: Molecular Baraminology Studies
Jean K. Lightner and Matyias Cserhati
Abstract
Though evolutionists routinely assume universal common descent of life, observational evidence militates against this unsubstantiated belief. In contrast, creationists recognize limited common descent where originally created kinds of organisms have reproduced to fill the earth. As they have done so, there has been considerable diversification and adaptation, though not enough to transmute them into a fundamentally different type of organism (e.g., from a rodent to a bat). Organisms that are not related by common descent can be recognized by significant holistic discontinuity between them. In this paper we begin an investigation of ruminants (Ruminantia), members of the order Artiodactyla, to determine if there is significant discontinuity between them and other species within this order. In this first paper, two molecular baraminology techniques were applied to available data to determine the relationship of ruminants to other artiodactyls. The results support the hypothesis that ruminants do not share common ancestry with other artiodactyls.
Key Words:Baraminology, ruminant, artiodactyl, gene content method, GCM, whole genome k-mer sequence, WGKS, statistical baraminology
Introduction
All honest supporters of the theory of evolution, who pay due attention to the facts, acknowledge further that the grounds for assuming the existence of a real relationship between the forms in question become more scanty when the higher divisions are considered. For the species of one genus these grounds often amount to great and even irrefutable probability, and the same may be said in not a few cases of the genera of one family, and occasionally for the families of one order, but it can seldom be maintained of the orders in one class. The evidence afforded by natural science for the theory of common descent becomes steadily weaker the higher we ascend the system . -Erich Wasmann (1910)
Over a century ago, the renowned entomologist, Erich Wasmann, clearly pointed out that universal common ancestry is unsupported by observations in the biological world. While he supported the idea that species can change (which fits one definition of the word evolution), he clearly rejected the idea that all life-forms are related, or that humans descended from apes (i.e., universal common descent, which fits another definition of evolution. As a Jesuit priest, he accepted the "Doctrine of Creation," recognizing that even the ability to change must have been endowed by a Creator. Wasmann's view of limited common ancestry (or limited common descent) is essentially the same as the view held by young-Earth creationists today (Wise, 1990; Friar, 2000; Wood et al., 2003; Jeanson, 2010; Hennigan, 2014; Ahlquist and Lightner, 2018, and a myriad of others).
There are some distinct groups of mammals (e.g., bats) that the average person can recognize as being obviously separate from all others in the class (Mammalia). This gap is evident in the morphology of extant species, as well as in the fossil record. In a creationist taxonomy, when a group is surrounded by such clear, systematic discontinuity, it is called an apobaramin (Wise, 1990; Wood et al., 2003). This implies that the members of the apobaramin do not share common ancestry with any creatures outside the group. It is still possible that not all members in the group share common ancestry, as they may represent more than one created kind (holobaramin, or sometimes just baramin).
We suggest that another apobaramin would be the order Artiodactyla, or even-toed ungulates. This order of herbivores has the axis of the feet between the third and fourth digits (a paraxonic limb structure), with the first digit absent in all extant species. Thus, they have an even number of toes, except in Tayassuididae (peccaries) which only has three digits on the hind limbs (Huffman, 2016). Although molecular studies that assume universal common descent have placed whales (order Cetacea) in this group, and some fossils have been suggested to fill in the gaps, we believe that such placement is implausible based on significant morphological and physiological differences.
Extant terrestrial Artiodactyla includes several suborders including Tylopoda (camelids), Suiformes (pigs and peccaries), and Ruminantia (ruminants) (Huffman, 2016). Initially, hippos had been placed in Suiformes, but the fact that molecular studies place them in with aquatic mammals suggests they may not be related to the pigs and peccaries. This is further supported by statistical baraminology analyses suggesting Camelidae, Suidae, and Hippopotamidae are each separate holobarmins (Thompson and Wood, 2018). In this series of studies, we will focus on the ruminants, highlighting through multiple lines of evidence that they form a very distinctive apobaramin. This strongly suggests they do not share common ancestry with other members of this order.
Ruminants are divided into six extant families: Antilocapridae (pronghorns), Bovidae (cattle, sheep, and antelopes), Cervidae (deer), Giraffidae (giraffes and okapis), Moschidae (musk deer), and Tragulidae (chevrotains). Previous creation studies have identified several monobaramins, or groups of organisms that share significant, holistic continuity and, thus, are likely related in that they are from the same baramin, as detailed below.
Sheep and goats comprise the subfamily Caprinae in the family Bovidae. Based on hybrids that have formed between the different species, and other evidence, it has been suggested that all Caprinae are related, forming a monobaramin (Lightner, 2006a). A similar conclusion was reached regarding the subfamily Bovinae, as hybrid data unites most of the group, and the remaining species appear very similar to those united by these data (Lightner, 2007). In Cervidae, two of the four traditionally recognized subfamilies (Cervinae and Odocoileinae, the latter of which is now recognized as Capreolinae) are united by hybrid data, forming a third ruminant monobarmin (Lightner, 2006b). While there have been occasional reports of hybrids between these three monobaramins, none were documented well enough to warrant uniting them based on currently available information. Thompson and Wood (2018) identified Moschidae as a monobaramin in a statistical baraminological study given its strong evidence for continuity between its members in baraminic distance correlation and multidimensional scaling. The same authors also analyzed Cervidae, but the results were inconclusive.
Here, in part I of this series, we use two different molecular techniques to detect clusters within the order Artiodactyla (cetaceans excepted). First, we applied the gene content method (GCM) to available proteome data. This technique was developed as part of the Creation Research Society (CRS) eKINDS (examination of kinds in natural diversification and speciation) project (O' Micks, 2017). Due to the small number of artiodactyls with sufficient protein data to be included, we also performed the Whole Genome K-mer Signature (WGKS) on available genomic data so more species could be compared. In Part 2 of this series, these molecular findings will be augmented with descriptive study of morphologic and physiologic characteristics of ruminants to further delineate the profound gap between them and other even-toed ungulates.
Materials and Methods
Usage of the Gene Content Method
The Gene Content Method (GCM) is a statistical method used in molecular baraminology to delineate baramins based on their common orthologous protein content (O'Micks, 2017). The whole proteomes for 15 Artiodactyl species (Table I) were downloaded from NCBI and were run against the OrthoMCL database at the EuPathDB Galaxy website (veupathdb.globusgenomics.org) to match them against orthologous protein groups (Chen et al., 2006). In an all-versus-all manner, the common orthologous protein content between all possible species pairs was computed and the Jaccard Coefficient Value (JCV) was calculated (common orthologous protein groups divided by the union of the orthologous protein groups) for each species pair. These values were put into a matrix, which was then visualized in a heatmap using the heatmap command using the 'ward.D2' clustering algorithm in R, version 4.0.1 (Figure 1). Ward clustering is a type of hierarchical clustering which minimizes within-cluster variance (Aldernderfer and Blashfield, 1984, p. 43). Higher JCVs are colored with lighter colors, denoting species belonging to the same cluster (and ideally, the same baramin), whereas lower values are colored in red, suggesting the pair of species belong to two separate groups (different baramins). The JCV matrix and statistical values for the main groups are available online in Supplementary File 1. An elbow and a silhouette plot were generated from this data to help with the interpretation; figures for these are located in Supplementary File 3 at https://github.com/csmatyi/artiodactyls .
Usage of the WGKS method
The whole genome sequence (WGS) for 80 Artiodactyl species (Table II) were downloaded from NCBI and analyzed using a Python script to generate the whole genome k-mer signature (WGKS) for each one, according to the protocol in Cserhati et al. (2019). The resulting Pearson Correlation Coefficient (PCC) matrix is available in online Supplementary File 2. The 'ward.D2' clustering algorithm was used here as well. On the heat map (Figure 2) higher correlation values are colored with brighter colors, denoting species belonging to the same cluster, whereas lower correlation values are colored in dark yellow to red, denoting a pair of species belonging to two separate groups, similar to the GCM.
Statistics are reported for each of the putative clusters, including the number of species, minimum, mean and maximum PCC values, standard deviation, and p-values. The p-values were calculated with the Student's t-test comparing PCC values within a given cluster versus PCC values between the species of the cluster and all other species in the study. These are listed in Supplementary File 2. An elbow and a silhouette plot were also generated from this data to help with the interpretation and is located in Supplementary File 3. All supplementary files and figures are located at https://github.com/csmatyi/artiodactyls.
Table I. The artiodactyl species included in the gene content method (GCM) analysis are listed according to their taxonomic placement. The superscripts 1–3 indicate which group they fell into in the study. The * indicates a species that did not cluster well with other species.
NON-RUMINANTS
Camelidae
Camelus_bactrianus (Bactrian camel)1
Camelus_dromedarius (Arabian camel)1
Camelus_ferus (Wild Bactrian camel)1
Vicugna_pacos (alpaca)1
RUMINANTS (Ruminantia)
Bovidae
Bovinae
Bos taurus (domestic cattle)2 B
os indicus (zebu cattle)2
Bos indicus x Bos taurus (Brahmin)2
Bos mutus (wild yak)2
Bison bison (American bison)2
Bubalus bubalis (domestic water buffalo)2
Caprinae
Ovis aries (sheep)*
Capra hircus (goat)*
Cervidae
Capreolinae
Odocoileus virginianus (white-tailed deer)2
Cervinae
Muntiacus reevesi (Reeves’s muntjac)3
Muntiacus muntjak (Indian muntjac)3
Results
The GCM heat map (Figure 1) shows three obvious clusters, and two species that are off by themselves. The silhouette plot indicates four as the ideal number of clusters (k); the elbow plot has a bend (elbow) at k = 4. When k = 4, the two species in the upper right form the fourth, less significant, cluster. The Hopkins clustering measure for the JCV matrix is 0.614, which is sufficient for meaningful clustering. The first cluster includes all four Camelidae species used in this study. The second group includes six species of Bovidae from the subfamily Bovinae and one species of Cervidae from the subfamily Capreolinae (formerly Odocoileinae). The third group includes the two members of the traditional Cervidae subfamily Muntiacinae, which has recently been lumped into Cervinae as a distinct tribe. Additionally, there are two species ( Ovis aries and Capra hircus ) that did not cluster with anything; they are from the Bovidae subfamily Caprinae.
The WGKS heat map (Figure 2) reveals two obvious clusters. Here the Hopkins clustering value is 0.89, which means that the PCC matrix is of very good quality for clustering. A very large cluster includes the majority of ruminants (45 of the 50 species from Bovidae, 14/15 Cervidae, 3/3 Giraffidae, 1/3 Moschidae, 0/1 Antilocapridae, 0/2 Tragulidae). A second cluster is comprised of all four camelids included in the study. An odd pattern is seen with some of the 9 species in the Bovidae subfamily Caprinae. Two ( Ovis canadensis and Capra hircus) are beside the large ruminant cluster, though they show obvious similarity to two other Caprinae species within the cluster ( Hemitragus hylocrius and Capra sibirica). Yet there are five other species from this subfamily, including another from each of the genera Ovis and Capra, that are well-integrated within the ruminant cluster.
Two of the Moschidae ( Moschus moschiferus and M. chrysogaster ) and two of the Bovidae ( Saiga tatarica and Beatragus hunteri ) are intermingled to the side of the two aberrant Caprinae species. The two Tragulidae species did not cluster with the ruminants, but they do show some similarity with each other despite being on opposite ends of the heat map. The cervid Rangifer tarandus (reindeer) and the bovid Alcelaphus buselaphus (hartebeest) are at the extremes of the heat map. R. tarandusis in the subfamily Capreolinae, which has five other species in the main ruminant cluster. Alcelaphus buselaphusis the family Alcelaphinae; of the four species included in this study, two are in the main ruminant cluster. The species from the monotypic Antilocapridae does not cluster with any other species and shows only weak similarity with some of the other ruminants.
Interestingly, both the elbow and silhouette plots suggest two as the optimal number of clusters, with three as a less probable alternative. When statistics were run for k = 2, eleven of the aberrant ruminants discussed above ended up in with the non-ruminants. The large ruminant cluster with 63 species had a p-value approaching zero, meaning it was a very highly significant cluster including species from three ruminant families. When statistics were run for k = 3, two non-ruminants (the hippo and pig), Alcelaphus buselaphus and two species of Tragulus remained in with the camelids, and eight of the eleven aberrant ruminant species separated into the third cluster. The p-values of these two groups were fairly high (less likely to be significant), while the large ruminant cluster remained the same, highly significant.
Regarding the heat maps, Figures 1 and 2 are not directly comparable to each other. The colors in the Figure 1 heatmap are darker yellow/orange than the points in the heatmap in Figure 2, which are much brighter yellow/white. The points in Figure 1 represent Jaccard Coefficient values calculated by the GC method, whereas the points in Figure 2 represent PCC values calculated by the WGKS algorithm. Supplementary File 3 shows a histogram of the JC and the PCC values, one above the other. As we can see in the top half of Supplementary Figure 1 in Supplementary File 3, the top of the JCV histogram is shifted to the left, towards lower values, with a mode of 0.937. The PCC values in the histogram in the bottom half of Supplementary Figure 1 are shifted to the right, towards higher values. The PCC values have a mode of 0.989. This is what causes the difference in the color of the points towards brighter colors in a large part of the heatmap in Figure 2. Supplementary File 3 can be found online at https://github.com/csmatyi/artiodactyls .
Discussion and Conclusions
The results support the hypothesis that ruminants are distinct from other artiodactyls. In the GCM study, proteins from Camelidae and Ruminantia were used. The four camelids formed a separate group from the ruminants. All ruminants in this study were from the families Bovidae and Cervidae, two of the six extant families of ruminants.
The WGKS study had data from more species and families available and gave similar results. Again, all four camelids in the study formed a clear group, and the majority of ruminants (63/74) fell in one huge cluster. The pig (Sus scrofa; Suiformes) shows the most discontinuity with all the other artiodactyls, with the lowest mean PCC value with all other species (0.922). The hippopotamus (Hippopotamus amphibius; Cetancodonta) showed less discontinuity. However, neither grouped with the large ruminant cluster.
What is more challenging to interpret are some of the ruminant species that do not cluster as would be predicted. For example, in the GCM results, the bovids from the subfamily Bovinae (cattle, bison, buffalo) cluster together with one species from Cervidae (Odocoileus virginianus), yet two other bovids from a separate subfamily (Caprinae) are off to one side showing discontinuity with the first group and each other, despite known hybrids between sheep (Ovis aries) and goats (Capra hircus). There is another small cluster of two cervids from the subfamily Cervinae. Errors in the database are one possibility; parameter settings may also have some influence. Another possibility is that these organisms have changed in ways that affect the results, though this seems less likely given the quantity of data used in these comparisons. This should be investigated in more detail in future studies.
A similar pattern is seen in the WGKS study. Here, all six extant families of ruminants had at least one representative in the study. One family, Giraffidae, has all members, of the three extant species included in this study, nested beside each other within the large ruminant cluster. Two families, Bovidae and Cervidae, had most species fall within the main cluster, though bovids are a bit spread out with most on either side of the giraffids and one (Ourebia ourebi) in the middle of the cervids. A fourth family, Moschidae, had only one of three species land in the main ruminant cluster. The final two ruminant families, Antilocapridae and Tragulidae, had only one and two species represented in the study, respectively. None fell within the large ruminant cluster.
Thus, while ruminants are distinct from other artiodactyls, there is some evidence the group may be divided by discontinuity as two families which are represented by three species did not fall in the main ruminant cluster. Two of these species are in Tragulidae, a family that lacks some of the traits typical of other ruminant families (horns, well-developed omasum with full rumination, etc.) (Janis and Theodor, 2014). The monotypic Antilocapridae (pronghorn) also did not group with the large ruminant cluster. This is a bit surprising as this ruminant species possesses traits (e.g., horn morphology) which seem intermediate between Bovidae and Cervidae, both of which are well represented within the large ruminant cluster. Other work has placed the Antilocapridae as a sister taxon to Giraffidae (Fernández and Vrba, 2005; Price et al., 2005).
The fact that Tragulidae and Antilocapridae did not fall in the ruminant cluster may hint at a polybaraminic status for Ruminantia. However, it is best to consider this tentative, especially for the monotypic Antilocapridae, due to the small number of species included in this study. Further, based on fossil evidence, if antilocaprids are related to other ruminants, they appear to have been separated from the other lineages for more time (Beatty and Martin, 2009). One or more factors appear to be adversely affecting the analysis, as members of the same genus should group together, especially if there is strong clustering above the genus level. The same can be said of species in one family when there is strong clustering above a family. Potential explanations for these apparently aberrant results include errors in the NCBI database, a defect in the algorithm or parameters settings, or, seemingly less probable, massive genetic shifts that affect a single species in a genus.
It should be noted that baraminological techniques use various clustering techniques (JCV and/or PCC). These methods will naturally cluster species into groups, just like evolutionary methods will naturally make phylogenetic trees. Whether or not the clusters are always biologically meaningful is an important concern. Therefore, looking at statistical significance and using various methods to visualize the results are important as we draw conclusions. For example, in the WGKS-method heat maps there were two visually obvious groups, and the rest of the species did not appear to group very well at all. If we had used statistics alone, this may not have been as obvious. As we continue to develop these methods, improving visualization and understanding when differences truly qualify as significant, holistic discontinuity is important considerations.
Finally, the NCBI databases are extremely valuable, yet not error-free (Rhie et al., 2020). As technologies improve, the quality of the database should as well. Complete proteomes for more species will become available. This highlights the fact that molecular studies should always be supplemented with other studies. We want to see consilience through multiple lines of evidence to support our conclusions about relationships. This will be done for ruminants using anatomic and physiologic data in Part 2 of this series, to show further evidence that the taxon Ruminantia constitutes an apobaramin, implying they do not share ancestry with any other extant suborders within Artiodactyla.
References
Ahlquist, J., and J. Lightner. 2018. Paradise kingfishers ( Tanysiptera spp.), the founder effect, and creation research. Creation Research Society Quarterly 55(1): 4-23.
Aldernderfer, M.S., and R.K. Blashfield. 1984. Cluster Analysis. SAGE Publications, Newbury Park, CA.
Beatty, B.L., and L.D. Martin. 2009. The earliest North American record of the Antilocapridae (Artiodactyla, Mammalia). PaleoBios 29(1): 29-35.
Chen, F., A.J. Mackey, C.J. Stoeckert, and D.S. Roos. 2006. OrthoMCL-DB: Querying a comprehensive multi-species collection of ortholog groups. Nucleic Acids Research 34: D363-D368.
Cserhati M, P. Xiao, and C. Guda. 2019. K-mer based motif analysis in insect species across Anopheles, Drosophila, and Glossina genera and its application to species classification. Computational and Mathematical Methods in Medicine , doi: 10.1155/2019/4259479
Cserhati, M.2020.A new baraminology method based on Whole Genome K-mer Signature analysis and its application to insect classification. Journal of Creation 34(1): 86-95.
Fernández, M.H.. and E.S. Vrba. 2005. A complete estimate of the phylogenetic relationships in Ruminantia: a dated species-level supertree of the extant ruminants. BiologicalReviews of the Cambridge Philosophical Society 80(2): 269-302.
Friar, W. 2000. Baraminology classification of created organisms. Creation Research Society Quarterly 37(2): 82-91.
Hennigan, T. 2014. An initial estimate toward identifying and numbering the Ark turtle and crocodile kinds. Answers Research Journal 7: 1-10.
Huffman, B. 2016. Order Artiodactyla: Even-toed ungulates ... and whales! The Ultimate Ungulate. Retrieved August 26, 2020 from http://www.ultimateungulate.com/Artiodactyla.html .
Janis, C.M., and J.M. Theodor. 2014. Cranial and postcranial morphological data in ruminant phylogenetics. Zitteliana Reihe B: Abhandlungen der Bayerischen Staatssammlung fur Palaontologie und Geologie 32(32): 15-31.
Jeanson, N. 2010. Common Ancestry and the Bible--Discerning Where to Draw the Line. Acts & Facts. 39(6): 6.
Lightner, J.K. 2006a. The baraminic status of the family Cervidae as determined using interspecific hybrid data. Occasional papers of the BSG 8:12-13. Retrieved from http://documents.clubexpress.com/documents.ashx?key=6FyKwSXHsz57v8ZJrts8fEYrGdpU%2f0FGieqqw2QiS0A%3d.
Lightner, J.K. 2006b. Identification of species within the sheep-goat kind (Tsoan monoaramin). Journal of Creation20(3): 61-65.
Lightner, J.K. 2007. Identification of species within the cattle monobaramin (kind). Journal of Creation21(1): 119-122.
O'Micks, J. 2017. Baraminology classification based on gene content similarity measurement. Creation Research Society Quarterly 54(1): 27-37.Price, S.A., O.R.P. Bininda-Emonds and J.L. Gittleman. 2005. A complete phylogeny of the whales, dolphins and even-toed hoofed mammals (Cetartiodactyla). Biological Reviews of the Cambridge Philosophical Society 80(3): 445-473.
Rhie, A., S.A. McCarthy, O. Fedrigo, et al. 2020. Towards complete and error-free genome assemblies of all vertebrate species. bioRxiv preprint, doi: https://doi.org/10.1101/2020.05.22.110833 .
Thompson, C., and T.C. Wood. 2018. A survey of Cenozoic mammal baramins. In Whitmore, J. H. (editor), Proceedings of the Eighth International Conference on Creationism , pp.217-221, A1-A83 (appendix). Creation Science Fellowship, Pittsburgh, PA. https://digitalcommons.cedarville.edu/icc_proceedings/vol8/iss1/43/ .
Wasmann, E., 1910. Modern Biology and the Theory of Evolution, translated from the third German edition by A.M. Buchanan. Kegan Paul, Trench, Trübner & Co., LTD, London. https://archive.org/stream/modernbiologythe00wasmuoft#page/n5/mode/2up .
Wise, K.P. 1990. Baraminology: A young-Earth creation biosystematic method. Proceedings of the Second International Conference on Creationism, pp. 345-360. Creation Science Fellowship, Pittsburgh, PA. https://digitalcommons.cedarville.edu/icc_proceedings/vol2/iss1/63 .
Wood, T.C. , K.P. Wise, R. Sanders, and N. Doran. 2003. A refined baramin concept. Occasional Papers of the Baraminology Study Group 3: 1-14. https://bsg.clubexpress.com/content.aspx?page_id=22&club_id=201240&module_id=36952 .
Tables and Figures
Table I. The artiodactyl species included in the gene content method (GCM) analysis are listed according to their taxonomic placement. The superscripts 1-3 indicate which group they fell into in the study. The * indicates a species that did not cluster well with other species.
Table II. The artiodactyl species included in the whole genome k-mer signature (WGKS) analysis are listed according to their taxonomic placement. The superscript c indicates species that visually grouped in the camelid cluster, an * indicates ruminants that did not fall in the large ruminant cluster.
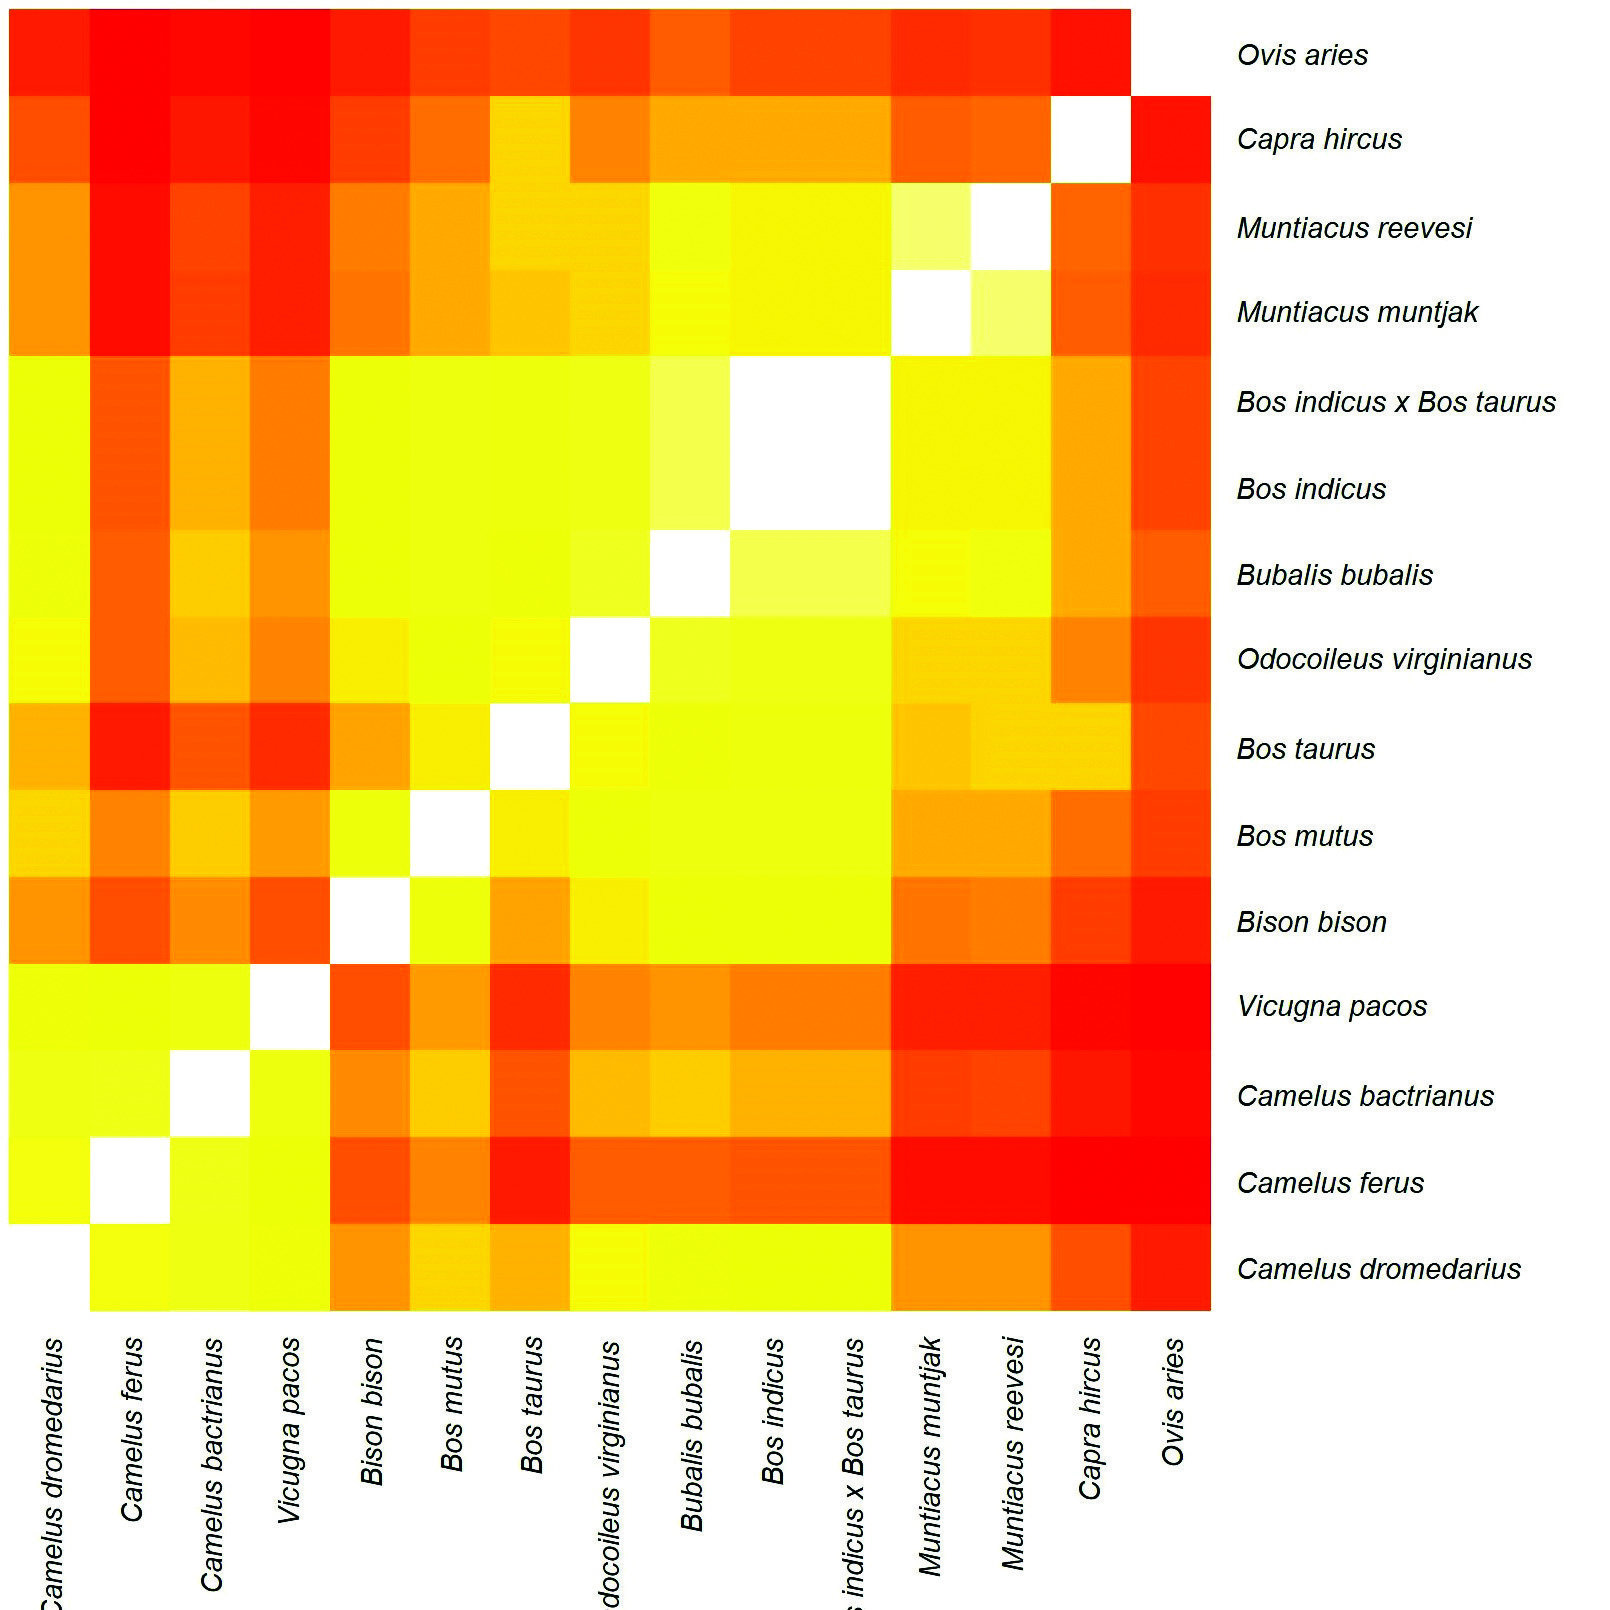
Figure 1. A heat map visually representing the relative similarity/dissimilarity within and between clusters as identified using the GCM. Note that every species listed on the right is also listed along the bottom. This way the gene content similarity between any two species can be visually represented according to a color scale. The nearly white squares that "stair-step" from the lower left to upper right are where each species is compared to itself, 100% similarity (identical). Yellow indicates high similarity/continuity; red indicates low similarity/discontinuity.
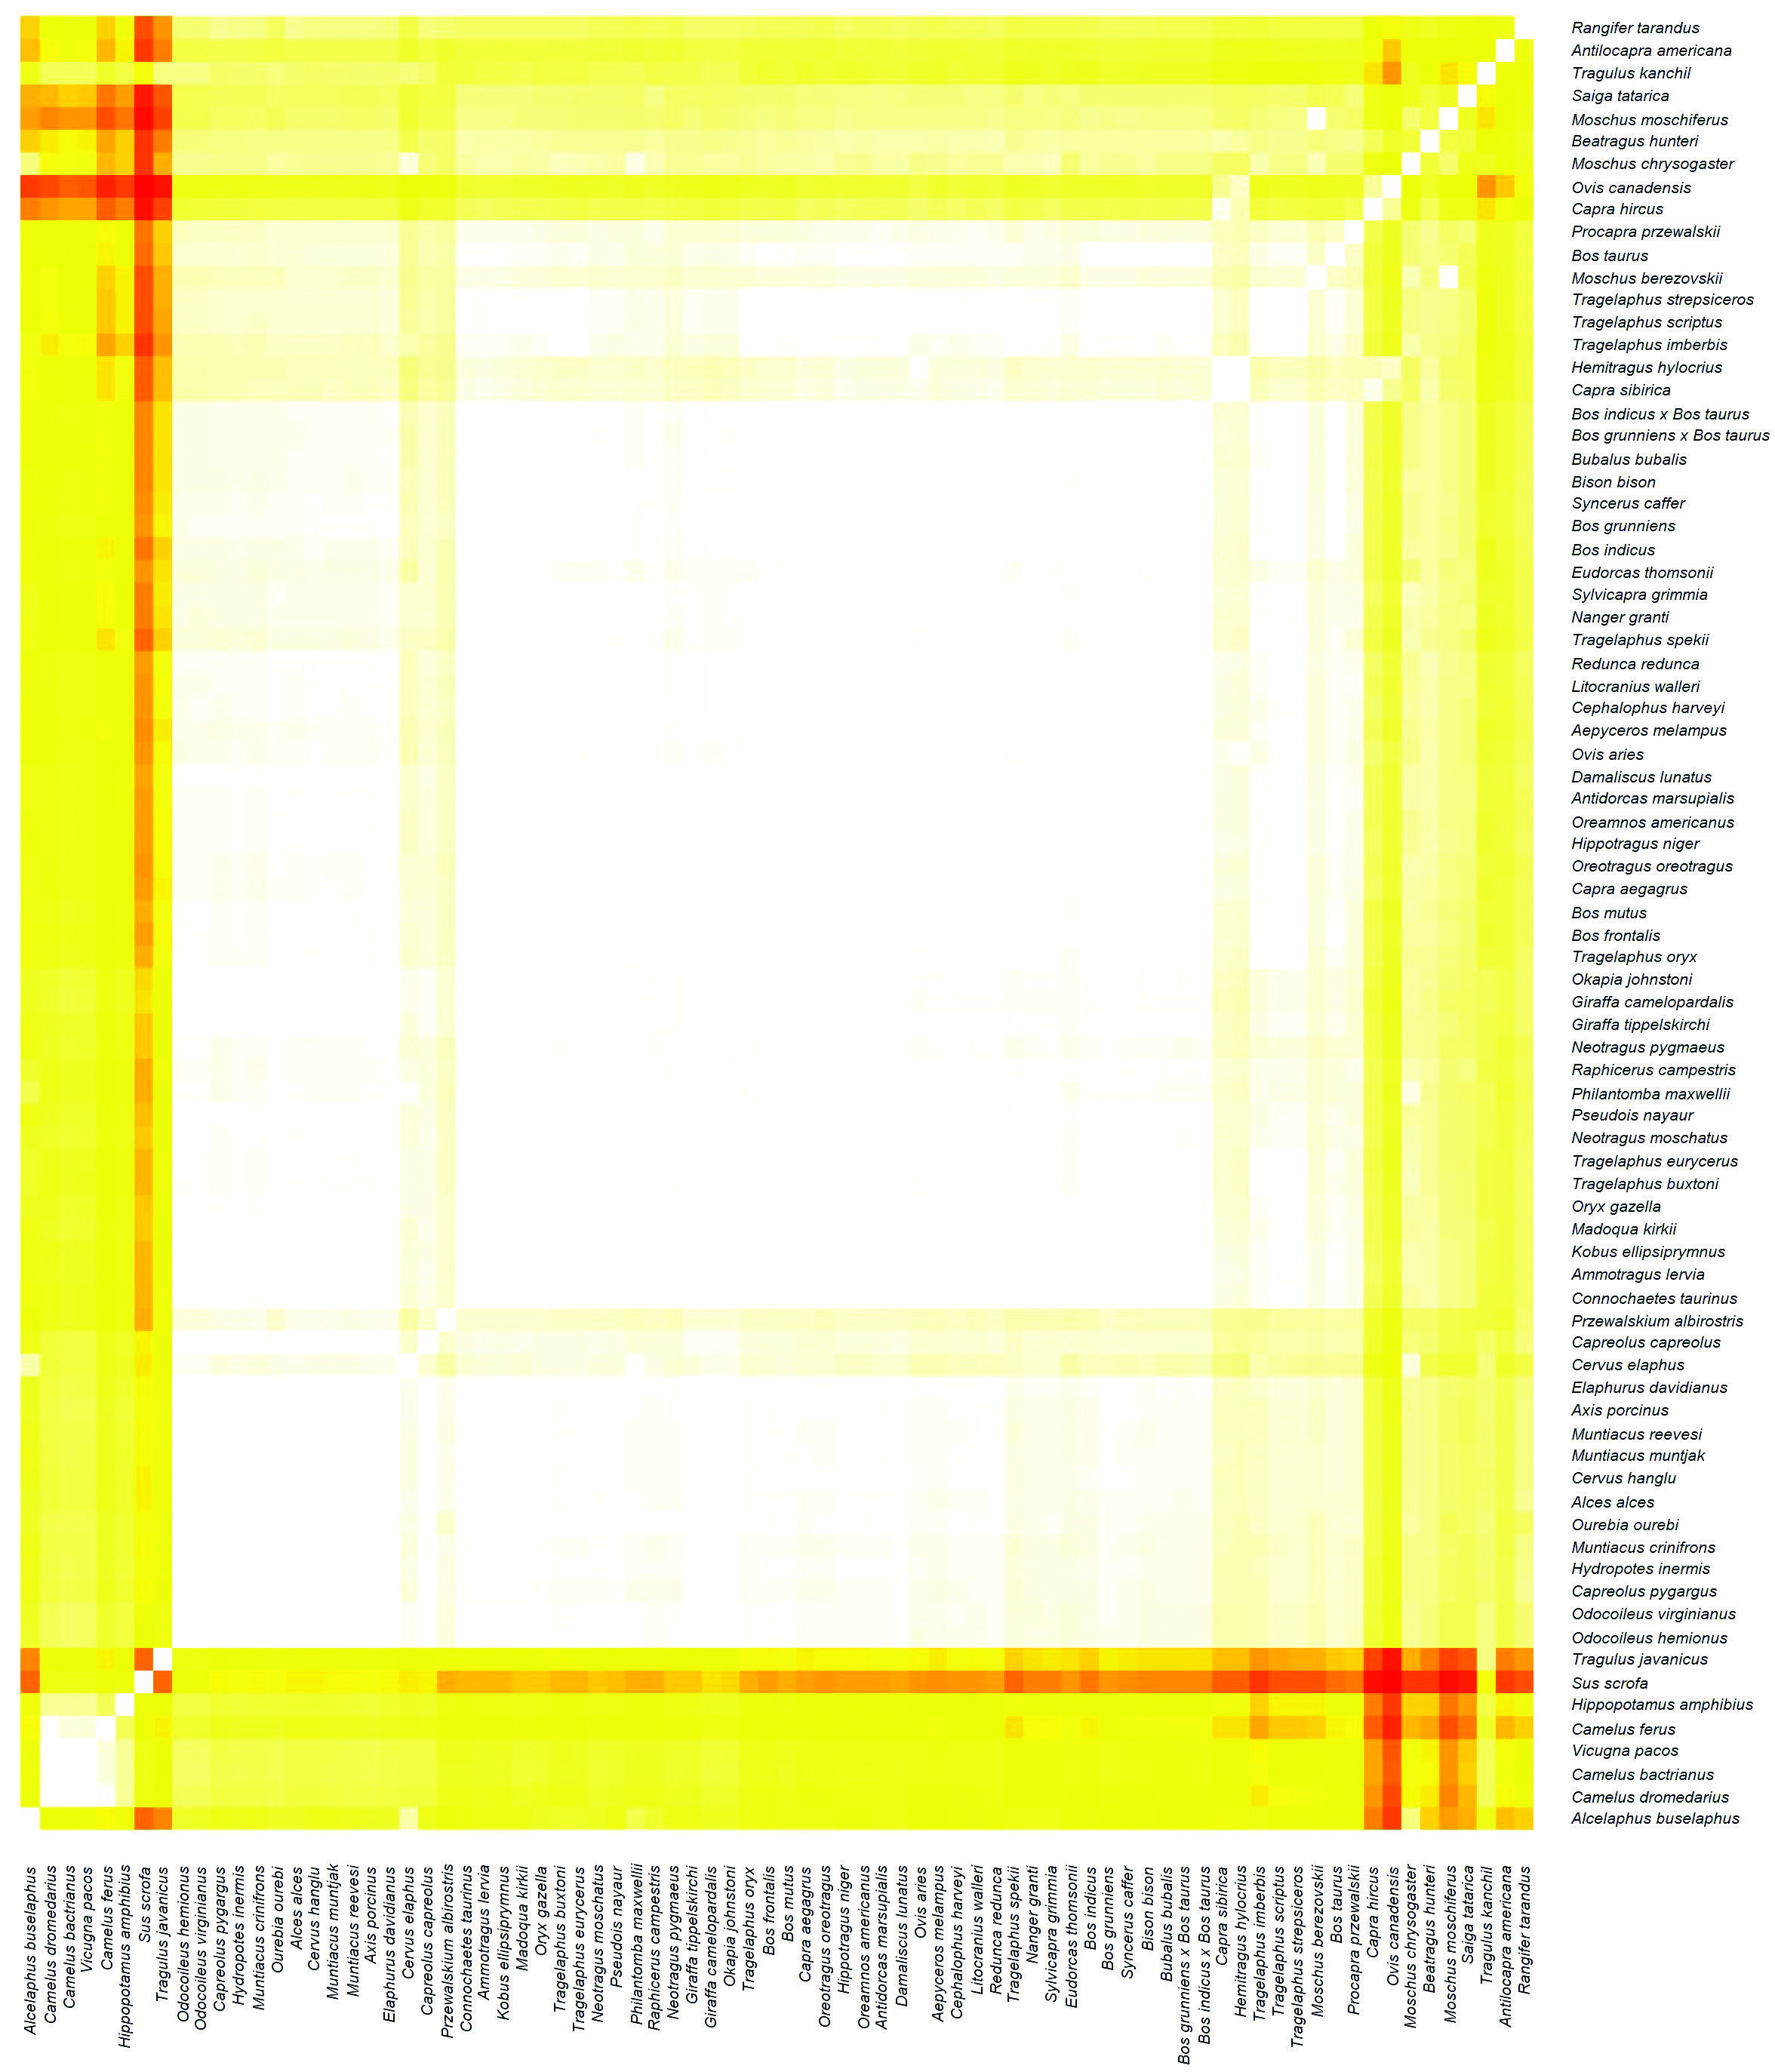
Figure 2. A heat map visually representing the relative similarity/dissimilarity within and between clusters as identified using the WGKS method. Here the value of the Pearson Correlation Coefficient is visualized according to a color scale. Each point in the heat map represents the correlation value between a given pair of species. More similar species pairs with higher correlation values are represented by lighter, yellow/white colors. Species pairs which are dissimilar with one another (lower correlation values) are represented by darker, orange/red colors.
|
Table I. The artiodactyl species included in the gene content method (GCM) analysis are listed according to their taxonomic placement. The superscripts 1–3 indicate which group they fell into in the study. The * indicates a species that did not cluster well with other species. NON-RUMINANTSFruit
|
|
Table I. The artiodactyl species included in the gene content method (GCM) analysis are listed according to their taxonomic placement. The superscripts 1–3 indicate which group they fell into in the study. The * indicates a species that did not cluster well with other species. NON-RUMINANTSBovidae
Cervidae
|